Wikipedia Event Logging Analysis
This comes from an interview task for a data analyst position at Wikipedia. I thought it would be good practice for working with SQL, product analysis, and data visualization/reporting.

Data as SQL
I took the data which was originally delivered in CSV and uploaded it to an AWS RDS instance so that I could simulate real world working conditions more closely. To do so I had to run a little bit of cleaning:
DELETE events_log WHERE events_log.session_id IN (SELECT session_id FROM events_log WHERE events_log.timestamp like '2.01%';
There were four time entries that got converted to bigint data formatting i.e. 2.01..+E13 in the CSV. Deleting all entries with session_ids related to those four entries resulted in 76 rows being deleted.
Note: all of the following comes directly from the task description
Background
Discovery (and other teams within the [Wikimedia] Foundation) rely on event logging (EL) to track a variety of performance and usage metrics to help us make decisions. Specifically, Discovery is interested in:
- clickthrough rate: the proportion of search sessions where the user clicked on one of the results displayed
- zero results rate: the proportion of searches that yielded 0 results
and other metrics outside the scope of this task. EL uses JavaScript to asynchronously send messages (events) to our servers when the user has performed specific actions. In this task, you will analyze a subset of our event logs.
Task
You must create a reproducible report* answering the following questions:
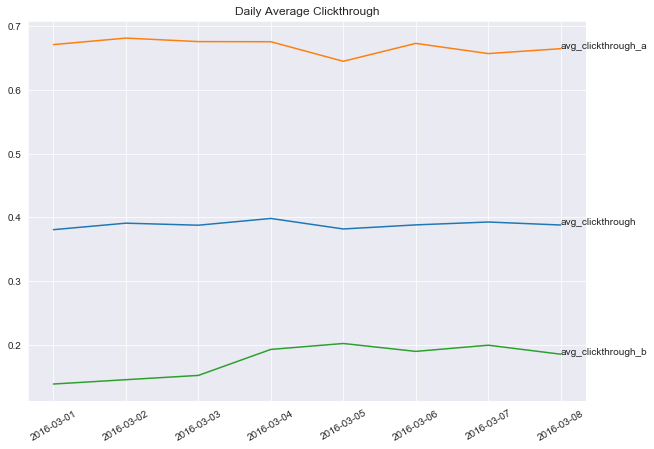
- What is our daily overall clickthrough rate? How does it vary between the groups?
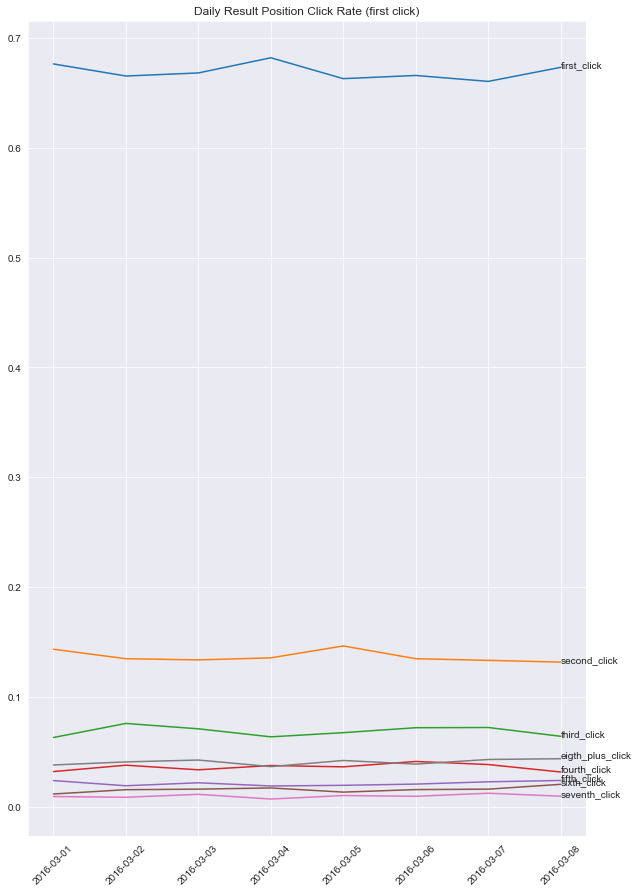
- Which results do people tend to try first? How does it change day-to-day?
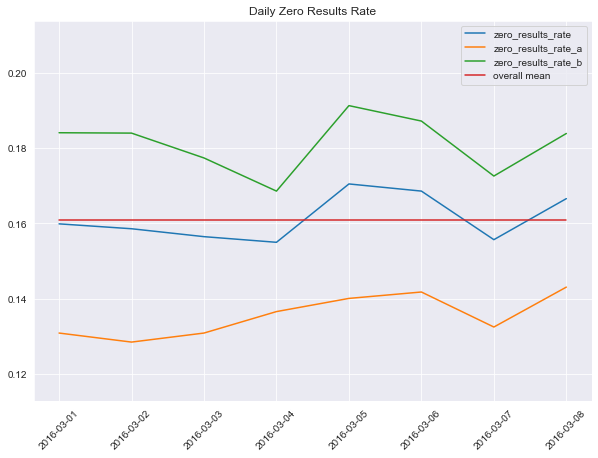
- What is our daily overall zero results rate? How does it vary between the groups?
- Let session length be approximately the time between the first event and the last event in a session. Choose a variable from the dataset and describe its relationship to session length. Visualize the relationship.
- Summarize your findings in an executive summary.
Data
The dataset comes from a tracking schema that we use for assessing user satisfaction. Desktop users are randomly sampled to be anonymously tracked by this schema which uses a “I’m alive” pinging system that we can use to estimate how long our users stay on the pages they visit. The dataset contains just a little more than a week of EL data.
| Column | Value | Description |
|---|---|---|
| uuid | string | Universally unique identifier (UUID) for backend event handling. |
| timestamp | integer | The date and time (UTC) of the event, formatted as YYYYMMDDhhmmss. |
| session_id | string | A unique ID identifying individual sessions. |
| group | string | A label (“a” or “b”). |
| action | string | Identifies in which the event was created. See below. |
| checkin | integer | How many seconds the page has been open for. |
| page_id | string | A unique identifier for correlating page visits and check-ins. |
| n_results | integer | Number of hits returned to the user. Only shown for searchResultPage events. |
| result_position | integer | The position of the visited page’s link on the search engine results page (SERP). |
The following are possible values for an event’s action field:
- searchResultPage: when a new search is performed and the user is shown a SERP.
- visitPage: when the user clicks a link in the results.
- checkin: when the user has remained on the page for a pre-specified amount of time.
Example Session
| uuid | timestamp | session_id | group | action | checkin | page_id | n_results | result_position |
|---|---|---|---|---|---|---|---|---|
| 4f699f344515554a9371fe4ecb5b9ebc | 20160305195246 | 001e61b5477f5efc | b | searchResultPage | NA | 1b341d0ab80eb77e | 7 | NA |
| 759d1dc9966353c2a36846a61125f286 | 20160305195302 | 001e61b5477f5efc | b | visitPage | NA | 5a6a1f75124cbf03 | NA | 1 |
| 77efd5a00a5053c4a713fbe5a48dbac4 | 20160305195312 | 001e61b5477f5efc | b | checkin | 10 | 5a6a1f75124cbf03 | NA | 1 |
| 42420284ad895ec4bcb1f000b949dd5e | 20160305195322 | 001e61b5477f5efc | b | checkin | 20 | 5a6a1f75124cbf03 | NA | 1 |
| 8ffd82c27a355a56882b5860993bd308 | 20160305195332 | 001e61b5477f5efc | b | checkin | 30 | 5a6a1f75124cbf03 | NA | 1 |
| 2988d11968b25b29add3a851bec2fe02 | 20160305195342 | 001e61b5477f5efc | b | checkin | 40 | 5a6a1f75124cbf03 | NA | 1 |
This user’s search query returned 7 results, they clicked on the first result, and stayed on the page between 40 and 50 seconds. (The next check-in would have happened at 50s.)
import numpy as np
import pandas as pd

import matplotlib.pyplot as plt
%matplotlib inline

import seaborn as sns
sns.set_style('darkgrid')

import datetime

%load_ext sql
%sql postgresql://postgres:wikipediapw@wikipedia-data.cepinogpzbip.us-west-2.rds.amazonaws.com:5432/postgres
'Connected: postgres@postgres'
Executive Summary
This report examines the events log for search/discovery on Wikipedia from 2016-03-01 to 2016-03-08. There are four major areas we will be examining:
- Clickthrough rate
- Which result people click on first
- Zero results rate (someone does a search and no results come back)
- Session length
We will be looking at this data through two major lenses:
- by groups (the sessions are divided into
group 'a'andgroup 'b') - by date
Group A vs. Group B
Although I’m not sure what group 'a' and group 'b' stand for from the task and data description there are significant differences in the metrics we are measuring with respect to the two groups:
- The clickthrough rate of
group 'a'(0.6696) is much higher than'group 'b'(0.1748) - The zero results rate of
group 'a'(0.1349) is much lower than'group 'b'(0.1807) - The session length of
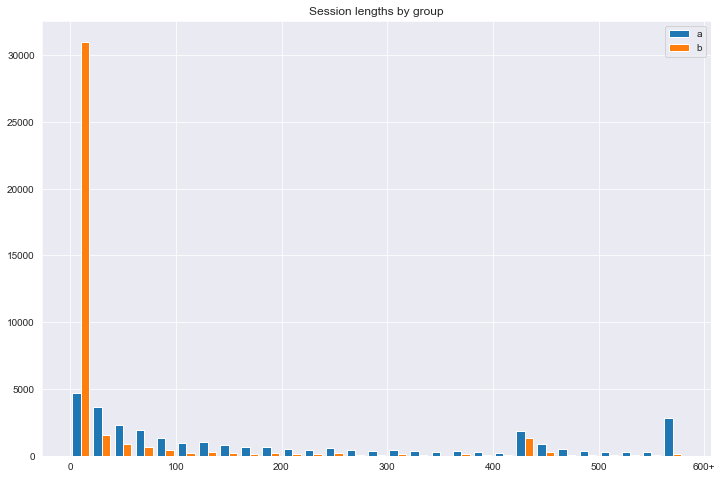
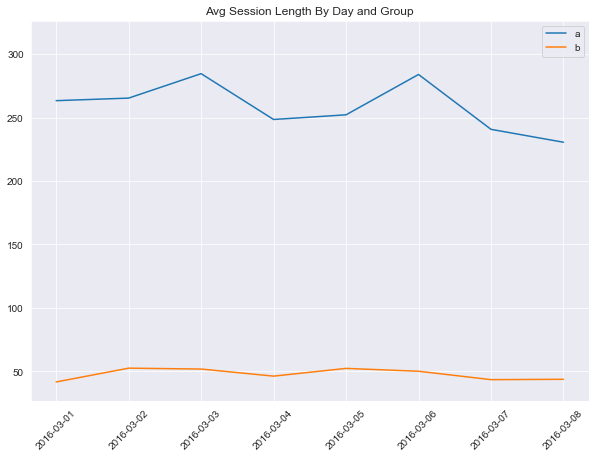
group 'a'(288.42) is much higher than'group 'b'(50.67)
Dates of note
- Between
2016-03-03and2016-03-04we saw a marked change in'group 'b'clickthrough rate from 0.1519 to 0.1927 - A peak of zero results in
group 'b'on2016-03-05, with dips before and after - A peak of zero results in
group 'a'on2016-03-06, with a steady rise before and a dip after - Peaks in session length for
group 'a'on2016-03-03and2016-03-06
Notes on which results people click on
There wasn’t much change at which result_position people clicked on over time. But of note, generally people click within the first 5-10 results. For example the first result on the second search page got more clicks than the 10th result on the first search page. Thus it might be worth reducing the number of search results per search results page to 10.
Daily Overall Clickthrough Rate
Answering this question: What is our daily overall clickthrough rate? How does it vary between the groups?
Given the data description above, we would expect every session to posess at least one action: searchResultPage. Let’s check this.
Some percentage of these sessions would also possess a visitPage action. This percentage would constitute the Clickthrough Rate.
# This query looks for the amount of hits of the searchResultPage per session, it should return at least 1 for each
# The validation check below confirms this
min_search_per_session = %sql \
WITH search_page_hits_per_session_id AS( \
    SELECT SUM(CASE WHEN action='searchResultPage' THEN 1 END) as search_page_hits \
    FROM events_log \
    GROUP BY events_log.session_id) \
SELECT MIN(search_page_hits) from search_page_hits_per_session_id;

# This gets the average overall clickthrough rate as well as for groups a and b
# The returns of this query are only valid if the check is valid
daily_avg_clickthrough = %sql \
WITH page_hits_per_session_id AS( \
    SELECT SUM(CASE WHEN action='searchResultPage' THEN 1 END) as search_page_hits, \
        SUM(CASE WHEN action='visitPage' THEN 1 END) as visit_page_hits, \
        DATE(timestamp) as date, \
        events_log.group \
    FROM events_log \
    GROUP BY events_log.session_id, date,  events_log.group) \
SELECT date,\
    ROUND(AVG(CASE WHEN visit_page_hits IS NOT NULL THEN 1 \
        ELSE 0 END), 4) AS avg_clickthrough, \
    ROUND(CAST(SUM(CASE WHEN visit_page_hits IS NOT NULL AND p.group = 'a' THEN 1 \
        ELSE 0 END)/CAST(SUM(CASE WHEN p.group='a' THEN 1 ELSE 0 END) AS FLOAT) AS NUMERIC), 4) AS avg_clickthrough_a, \
    ROUND(CAST(SUM(CASE WHEN visit_page_hits IS NOT NULL AND p.group = 'b' THEN 1 \
        ELSE 0 END)/CAST(SUM(CASE WHEN p.group='b' THEN 1 ELSE 0 END) AS FLOAT) AS NUMERIC), 4) AS avg_clickthrough_b \
FROM page_hits_per_session_id AS p\
GROUP BY date \
ORDER BY date;

# reformat data so it can be plotted
daily_avg_clickthrough = pd.DataFrame(daily_avg_clickthrough, columns=daily_avg_clickthrough.keys)
daily_avg_clickthrough.avg_clickthrough = daily_avg_clickthrough.avg_clickthrough.astype(float)
daily_avg_clickthrough.avg_clickthrough_a = daily_avg_clickthrough.avg_clickthrough_a.astype(float)
daily_avg_clickthrough.avg_clickthrough_b = daily_avg_clickthrough.avg_clickthrough_b.astype(float)

# validation check that our assumption holds
assert(min_search_per_session[0][0] >=1)

# print the table and graph
print('\n--------------------------------------------------------------------------------\n')
# table
print('Daily Average Clickthrough\n')
print(daily_avg_clickthrough)
print('\n--------------------------------------------------------------------------------\n')
# graph
plt.figure(figsize=(10,7))
plt.title('Daily Average Clickthrough')
for series in ['avg_clickthrough', 'avg_clickthrough_a', 'avg_clickthrough_b']:
    x = daily_avg_clickthrough.date
    y = daily_avg_clickthrough[series]
    plt.plot(x, y, label = series)
    plt.text(x.iloc[-1], y.iloc[-1], series)
plt.xticks(rotation=30)
plt.show()
 * postgresql://postgres:***@wikipedia-data.cepinogpzbip.us-west-2.rds.amazonaws.com:5432/postgres
1 rows affected.
 * postgresql://postgres:***@wikipedia-data.cepinogpzbip.us-west-2.rds.amazonaws.com:5432/postgres
8 rows affected.

--------------------------------------------------------------------------------

Daily Average Clickthrough

         date  avg_clickthrough  avg_clickthrough_a  avg_clickthrough_b
0  2016-03-01            0.3806              0.6710              0.1384
1  2016-03-02            0.3908              0.6812              0.1452
2  2016-03-03            0.3876              0.6757              0.1519
3  2016-03-04            0.3982              0.6755              0.1927
4  2016-03-05            0.3817              0.6448              0.2020
5  2016-03-06            0.3881              0.6729              0.1896
6  2016-03-07            0.3926              0.6569              0.1993
7  2016-03-08            0.3879              0.6646              0.1852

--------------------------------------------------------------------------------
%%sql
WITH page_hits_per_session_id AS(
    SELECT SUM(CASE WHEN action='searchResultPage' THEN 1 END) as search_page_hits,
        SUM(CASE WHEN action='visitPage' THEN 1 END) as visit_page_hits,
        events_log.group
    FROM events_log
    GROUP BY events_log.session_id, events_log.group)
SELECT
    ROUND(AVG(CASE WHEN visit_page_hits IS NOT NULL THEN 1
        ELSE 0 END), 4) AS avg_clickthrough,
    ROUND(CAST(SUM(CASE WHEN visit_page_hits IS NOT NULL AND p.group = 'a' THEN 1
        ELSE 0 END)/CAST(SUM(CASE WHEN p.group='a' THEN 1 ELSE 0 END) AS FLOAT) AS NUMERIC), 4) AS avg_clickthrough_a,
    ROUND(CAST(SUM(CASE WHEN visit_page_hits IS NOT NULL AND p.group = 'b' THEN 1
        ELSE 0 END)/CAST(SUM(CASE WHEN p.group='b' THEN 1 ELSE 0 END) AS FLOAT) AS NUMERIC), 4) AS avg_clickthrough_b
FROM page_hits_per_session_id AS p;
 * postgresql://postgres:***@wikipedia-data.cepinogpzbip.us-west-2.rds.amazonaws.com:5432/postgres
1 rows affected.
| avg_clickthrough | avg_clickthrough_a | avg_clickthrough_b |
|---|---|---|
| 0.3888 | 0.6696 | 0.1748 |
Which Result First
Question: Which results do people tend to try first? How does it change day-to-day?
Of note, within one session a person may visit the searchResultsPage multiple times. These searchResultPage visits may occur before or after clicking on a result. What we want is the first instance of clicking on a result. We will want to find two results: 1) how many searchResultPages did they visit before clicking on the first result. 2) which result on the searchResultPage of interest did they click on.
# final_page_position: selects the result_position on the last searchResultPage before the first visitPage
# clicked_sessions: selects the visitPages for each session, with their ordering
# pages_before: counts the number of searchResultPages before the first visitPage
# first_click_time: selects the timestamp of the first visitPage
final_result_positions = %sql WITH \
final_page_position AS( \
    WITH clicked_sessions AS( \
        SELECT uuid, session_id, \
            ROW_NUMBER() OVER(PARTITION BY session_id ORDER BY timestamp) AS order_click \
        FROM events_log AS e \
        WHERE e.action = 'visitPage') \
    SELECT e.session_id, \
        result_position AS result_position_first_click \
    FROM events_log AS e \
        JOIN clicked_sessions as c \
        USING(uuid) \
    WHERE c.order_click=1), \
pages_before AS( \
    WITH first_click_time AS ( \
    SELECT session_id, timestamp \
        FROM ( \
            SELECT session_id, \
                timestamp, \
                ROW_NUMBER() OVER(PARTITION BY session_id ORDER BY timestamp) AS order_click \
            FROM events_log AS e \
            WHERE e.action = 'visitPage') AS visit_pages_ordered \
        WHERE visit_pages_ordered.order_click = 1) \
    SELECT session_id, COUNT(1)-1 AS pages_before_clicked_page \
    FROM events_log AS e \
        JOIN first_click_time AS fct \
        USING(session_id) \
    WHERE e.action='searchResultPage' AND e.timestamp < fct.timestamp \
    GROUP BY session_id) \
SELECT session_id, \
    f.result_position_first_click + 20*b.pages_before_clicked_page AS final_result_position \
FROM final_page_position AS f \
    JOIN pages_before AS b \
    USING(session_id);

#convert results to pandas dataframe
final_result_positions = pd.DataFrame(final_result_positions, columns = final_result_positions.keys)
 * postgresql://postgres:***@wikipedia-data.cepinogpzbip.us-west-2.rds.amazonaws.com:5432/postgres
26359 rows affected.
#plot the results data
plt.figure(figsize=(15,7))
bins = list(range(60))
plt.hist(np.clip(final_result_positions.final_result_position, bins[0], bins[-1]), bins=bins)
locs, labels = plt.xticks()
locs = locs[1:-1]
new_labels = [str(int(n)) for n in locs]
new_labels[-1] += '+'
plt.xticks(locs, new_labels)
plt.title('Which result clicked on first')
plt.show()
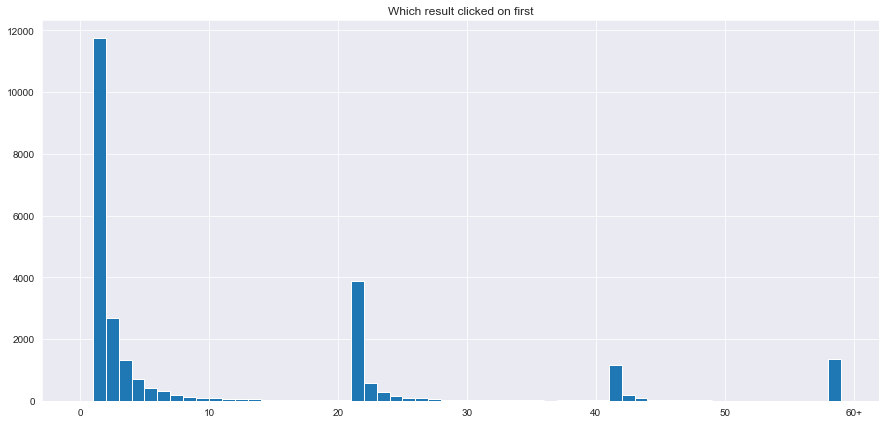
Notice this has a power law distribution that repeats every 20 results(the number of results in a new page). We want to be able to visualize somehow how this powerlaw changes by day. What we can do is:
1) not worry about tracking the number of searchResultPages before a click (because this powerlaw is the same on each searchResultPage)
2) look at number of first clicks, second clicks, third clicks, fourth clicks, fifth clicks, sixth click +, and how that changes per day (perhaps normalizing by the total traffic per day)
# first_click gives the uuid for the first visitPage per session
# from that we select the rate that the first page is clicked on etc.
# grouped by the date
click_position_rates = %sql \
WITH first_click AS ( \
    SELECT session_id, uuid \
    FROM ( \
        SELECT session_id, \
            uuid, \
            ROW_NUMBER() OVER(PARTITION BY session_id ORDER BY timestamp) AS order_click \
        FROM events_log AS e \
        WHERE e.action = 'visitPage') AS visit_pages_ordered \
    WHERE visit_pages_ordered.order_click = 1) \
SELECT DATE(e.timestamp) AS date, \
    ROUND(AVG(CASE WHEN result_position = 1 THEN 1 ELSE 0 END), 4) AS first_click, \
    ROUND(AVG(CASE WHEN result_position = 2 THEN 1 ELSE 0 END), 4) AS second_click, \
    ROUND(AVG(CASE WHEN result_position = 3 THEN 1 ELSE 0 END), 4) AS third_click, \
    ROUND(AVG(CASE WHEN result_position = 4 THEN 1 ELSE 0 END), 4) AS fourth_click, \
    ROUND(AVG(CASE WHEN result_position = 5 THEN 1 ELSE 0 END), 4) AS fifth_click, \
    ROUND(AVG(CASE WHEN result_position = 6 THEN 1 ELSE 0 END), 4) AS sixth_click, \
    ROUND(AVG(CASE WHEN result_position = 7 THEN 1 ELSE 0 END), 4) AS seventh_click, \
    ROUND(AVG(CASE WHEN result_position >= 8 THEN 1 ELSE 0 END), 4) AS eigth_plus_click \
FROM events_log AS e \
    JOIN first_click AS fc \
    USING(session_id) \
WHERE e.action='visitPage' AND e.uuid=fc.uuid \
GROUP BY date;

# convert to pandas dataframe
click_position_rates = pd.DataFrame(click_position_rates, columns=click_position_rates.keys)

# plot the rate changes for first click, second click, etc by date
series_labels = list(click_position_rates.columns)[1:]
plt.figure(figsize=(10,15))
plt.title('Daily Result Position Click Rate (first click)')
for series_label in series_labels:
    x = click_position_rates.date
    y = click_position_rates[series_label]
    plt.plot(x, y)
    plt.text(x.iloc[-1], y.iloc[-1], series_label)
plt.xticks(rotation=45)
plt.show()
 * postgresql://postgres:***@wikipedia-data.cepinogpzbip.us-west-2.rds.amazonaws.com:5432/postgres
8 rows affected.
Zero Results
Question: What is our daily overall zero results rate? How does it vary between the groups?
# result_page_w_order gives us the order of the searchResultPages
# using this we take only the first searchResultPage per session
# and look at the rate of zero results on that page
# if we don't filter by the first page, then multiple searchResultPages within a session can skew the numbers
zero_result_rates = %sql \
WITH result_page_w_order AS( \
    SELECT uuid, \
        ROW_NUMBER() OVER(PARTITION BY session_id ORDER BY timestamp) AS order_in_session \
    FROM events_log AS e \
    WHERE e.action='searchResultPage') \
SELECT DATE(timestamp) AS date, \
    ROUND(AVG(CASE WHEN n_results = 0 THEN 1 ELSE 0 END), 4) AS zero_results_rate, \
    ROUND(CAST(SUM(CASE WHEN n_results = 0 AND e.group='a' THEN 1 \
        ELSE 0 END)/CAST(SUM(CASE WHEN e.group='a' THEN 1 ELSE 0 END) AS FLOAT) AS NUMERIC), 4) AS zero_results_rate_a, \
    ROUND(CAST(SUM(CASE WHEN n_results = 0 AND e.group='b' THEN 1 \
        ELSE 0 END)/CAST(SUM(CASE WHEN e.group='b' THEN 1 ELSE 0 END) AS FLOAT) AS NUMERIC), 4) AS zero_results_rate_b \
FROM events_log AS e \
    JOIN result_page_w_order \
    USING(uuid) \
WHERE order_in_session=1 \
GROUP BY date;

# this will give us an overall mean that will help with comparisons over different days
mean_zero_result_rate = %sql \
WITH result_page_w_order AS( \
    SELECT uuid, \
        ROW_NUMBER() OVER(PARTITION BY session_id ORDER BY timestamp) AS order_in_session \
    FROM events_log AS e \
    WHERE e.action='searchResultPage') \
SELECT ROUND(AVG(CASE WHEN n_results = 0 THEN 1 ELSE 0 END), 4) \
FROM events_log AS e \
    JOIN result_page_w_order \
    USING(uuid) \
WHERE order_in_session=1;

# convert formats
zero_result_rates = pd.DataFrame(zero_result_rates, columns=zero_result_rates.keys)
mean_zero_result_rate = mean_zero_result_rate[0][0]

# Print the table and graph:
print('\n--------------------------------------------------------------------------------\n')
# print table
print('Daily Zero Results Rate\n')
print(zero_result_rates)
print('\n--------------------------------------------------------------------------------\n')
# percent_stretch_y stretches the y limits of the graph slightly so that the fluctuations don't dominate the graph
percent_stretch_y = 0.1
# print graph
series_labels = list(zero_result_rates.columns)[1:]
plt.figure(figsize=(10,7))
plt.title('Daily Zero Results Rate')
for series_label in series_labels:
    x = zero_result_rates.date
    y = zero_result_rates[series_label]
    plt.plot(x,y, label = series_label)
    #plt.text(x.iloc[-1], y.iloc[-1], series_label)
# plot the mean rate as well
x = zero_result_rates.date
y = [mean_zero_result_rate]*len(x)
plt.plot(x, y, label='overall mean')
# formatting
plt.legend(loc='best')
plt.xticks(rotation=45)
ylim = plt.ylim()
ylim = (ylim[0]*(1-percent_stretch_y), ylim[1]*(1+percent_stretch_y))
plt.ylim(ylim)
plt.show()
 * postgresql://postgres:***@wikipedia-data.cepinogpzbip.us-west-2.rds.amazonaws.com:5432/postgres
8 rows affected.
 * postgresql://postgres:***@wikipedia-data.cepinogpzbip.us-west-2.rds.amazonaws.com:5432/postgres
1 rows affected.

--------------------------------------------------------------------------------

Daily Zero Results Rate

         date zero_results_rate zero_results_rate_a zero_results_rate_b
0  2016-03-01            0.1599              0.1309              0.1841
1  2016-03-02            0.1586              0.1285              0.1840
2  2016-03-03            0.1565              0.1309              0.1774
3  2016-03-04            0.1550              0.1366              0.1686
4  2016-03-05            0.1705              0.1401              0.1913
5  2016-03-06            0.1686              0.1418              0.1872
6  2016-03-07            0.1557              0.1325              0.1726
7  2016-03-08            0.1666              0.1431              0.1839

--------------------------------------------------------------------------------
%%sql
WITH result_page_w_order AS(
    SELECT uuid,
        ROW_NUMBER() OVER(PARTITION BY session_id ORDER BY timestamp) AS order_in_session
    FROM events_log AS e
    WHERE e.action='searchResultPage')
SELECT e.group, ROUND(AVG(CASE WHEN n_results = 0 THEN 1 ELSE 0 END), 4) AS avg_zero_rate
FROM events_log AS e
    JOIN result_page_w_order
    USING(uuid)
WHERE order_in_session=1
GROUP BY e.group
 * postgresql://postgres:***@wikipedia-data.cepinogpzbip.us-west-2.rds.amazonaws.com:5432/postgres
2 rows affected.
| group | avg_zero_rate |
|---|---|
| a | 0.1349 |
| b | 0.1807 |
Session Length
Question: Let session length be approximately the time between the first event and the last event in a session. Choose a variable from the dataset and describe its relationship to session length. Visualize the relationship.
I’ll map session length against group and also map the average by group by day.
session_len_group = %sql \
SELECT e.group, \
    MAX(timestamp) - MIN(timestamp) AS session_length \
FROM events_log AS e \
GROUP BY e.group, e.session_id;

session_len_group = pd.DataFrame(session_len_group, columns=session_len_group.keys)
session_len_group.session_length = session_len_group.session_length.dt.total_seconds().astype(int)

plt.figure(figsize=[12,8])
bins = list(range(0, 600, 20))
a = np.clip(session_len_group.session_length[session_len_group.group=='a'], bins[0], bins[-1])
b = np.clip(session_len_group.session_length[session_len_group.group=='b'], bins[0], bins[-1])
plt.hist([a, b], bins=bins, label=['a', 'b'])
locs, labels = plt.xticks()
locs = locs[1:-1]
new_labels = [str(int(n)) for n in locs]
new_labels[-1] += '+'
plt.xticks(locs, new_labels)
plt.legend(loc='best')
plt.title('Session lengths by group')
plt.show()
 * postgresql://postgres:***@wikipedia-data.cepinogpzbip.us-west-2.rds.amazonaws.com:5432/postgres
68024 rows affected.
sess_len_date_group = %sql \
SELECT \
    session_lengths.date, \
    session_lengths.group, \
    ROUND(CAST(AVG(session_lengths.session_length) AS NUMERIC), 2) AS avg_session_length \
FROM ( \
    SELECT \
        DATE(timestamp) AS date, \
        e.group, \
        EXTRACT(EPOCH FROM MAX(timestamp) - MIN(timestamp)) AS session_length \
    FROM events_log AS e \
    GROUP BY date, e.group, e.session_id) AS session_lengths \
GROUP BY session_lengths.group, session_lengths.date \
ORDER BY session_lengths.date, session_lengths.group;

sess_len_date_group = pd.DataFrame(sess_len_date_group, columns = sess_len_date_group.keys)

# Print the table and graph:
print('\n--------------------------------------------------------------------------------\n')
# print table
print('Avg Session Length By Day and Group\n')
print(sess_len_date_group)
print('\n--------------------------------------------------------------------------------\n')
# percent_stretch_y stretches the y limits of the graph slightly so that the fluctuations don't dominate the graph
percent_stretch_y = 0.1
# print graph
plt.figure(figsize=(10,7))
plt.title('Avg Session Length By Day and Group')
for group in ['a' ,'b']:
    x = sess_len_date_group.date[sess_len_date_group.group == group]
    y = sess_len_date_group.avg_session_length[sess_len_date_group.group == group]
    plt.plot(x,y, label = group)
    #plt.text(x.iloc[-1], y.iloc[-1], series_label)
# formatting
plt.legend(loc='best')
plt.xticks(rotation=45)
ylim = plt.ylim()
ylim = (ylim[0]*(1-percent_stretch_y), ylim[1]*(1+percent_stretch_y))
plt.ylim(ylim)
plt.show()
 * postgresql://postgres:***@wikipedia-data.cepinogpzbip.us-west-2.rds.amazonaws.com:5432/postgres
16 rows affected.

--------------------------------------------------------------------------------

Avg Session Length By Day and Group

          date group avg_session_length
0   2016-03-01     a             263.27
1   2016-03-01     b              41.70
2   2016-03-02     a             265.29
3   2016-03-02     b              52.56
4   2016-03-03     a             284.54
5   2016-03-03     b              51.86
6   2016-03-04     a             248.45
7   2016-03-04     b              46.28
8   2016-03-05     a             252.13
9   2016-03-05     b              52.38
10  2016-03-06     a             283.90
11  2016-03-06     b              50.13
12  2016-03-07     a             240.68
13  2016-03-07     b              43.51
14  2016-03-08     a             230.52
15  2016-03-08     b              43.78

--------------------------------------------------------------------------------
%%sql
SELECT
    session_lengths.group,
    ROUND(CAST(AVG(session_lengths.session_length) AS NUMERIC), 2) AS avg_session_length
FROM (
    SELECT
        e.group,
        EXTRACT(EPOCH FROM MAX(timestamp) - MIN(timestamp)) AS session_length
    FROM events_log AS e
    GROUP BY e.group, e.session_id) AS session_lengths
GROUP BY session_lengths.group
ORDER BY session_lengths.group;
 * postgresql://postgres:***@wikipedia-data.cepinogpzbip.us-west-2.rds.amazonaws.com:5432/postgres
2 rows affected.
| group | avg_session_length |
|---|---|
| a | 288.42 |
| b | 50.67 |